This class project was created in collaboration with The Design Studio for Social Intervention (ds4si). It's an investigation into hack-a-diagram, an engagement tool originally designed by Judith Leemann.
Our task was to research and redesign hack-a-diagram in order for it to be more effectively disseminated as part of ds4si's forthcoming Design Gym toolkit.
Linked here is ds4si's webpage, where you can learn more about their projects, including the Design Gym.
I dove into researching the tool to better understand the diagrams' impacts on how we map different topics, and repackaged it into multiple volumes— transforming the diagrams disparate impacts into facilitation opportunities.

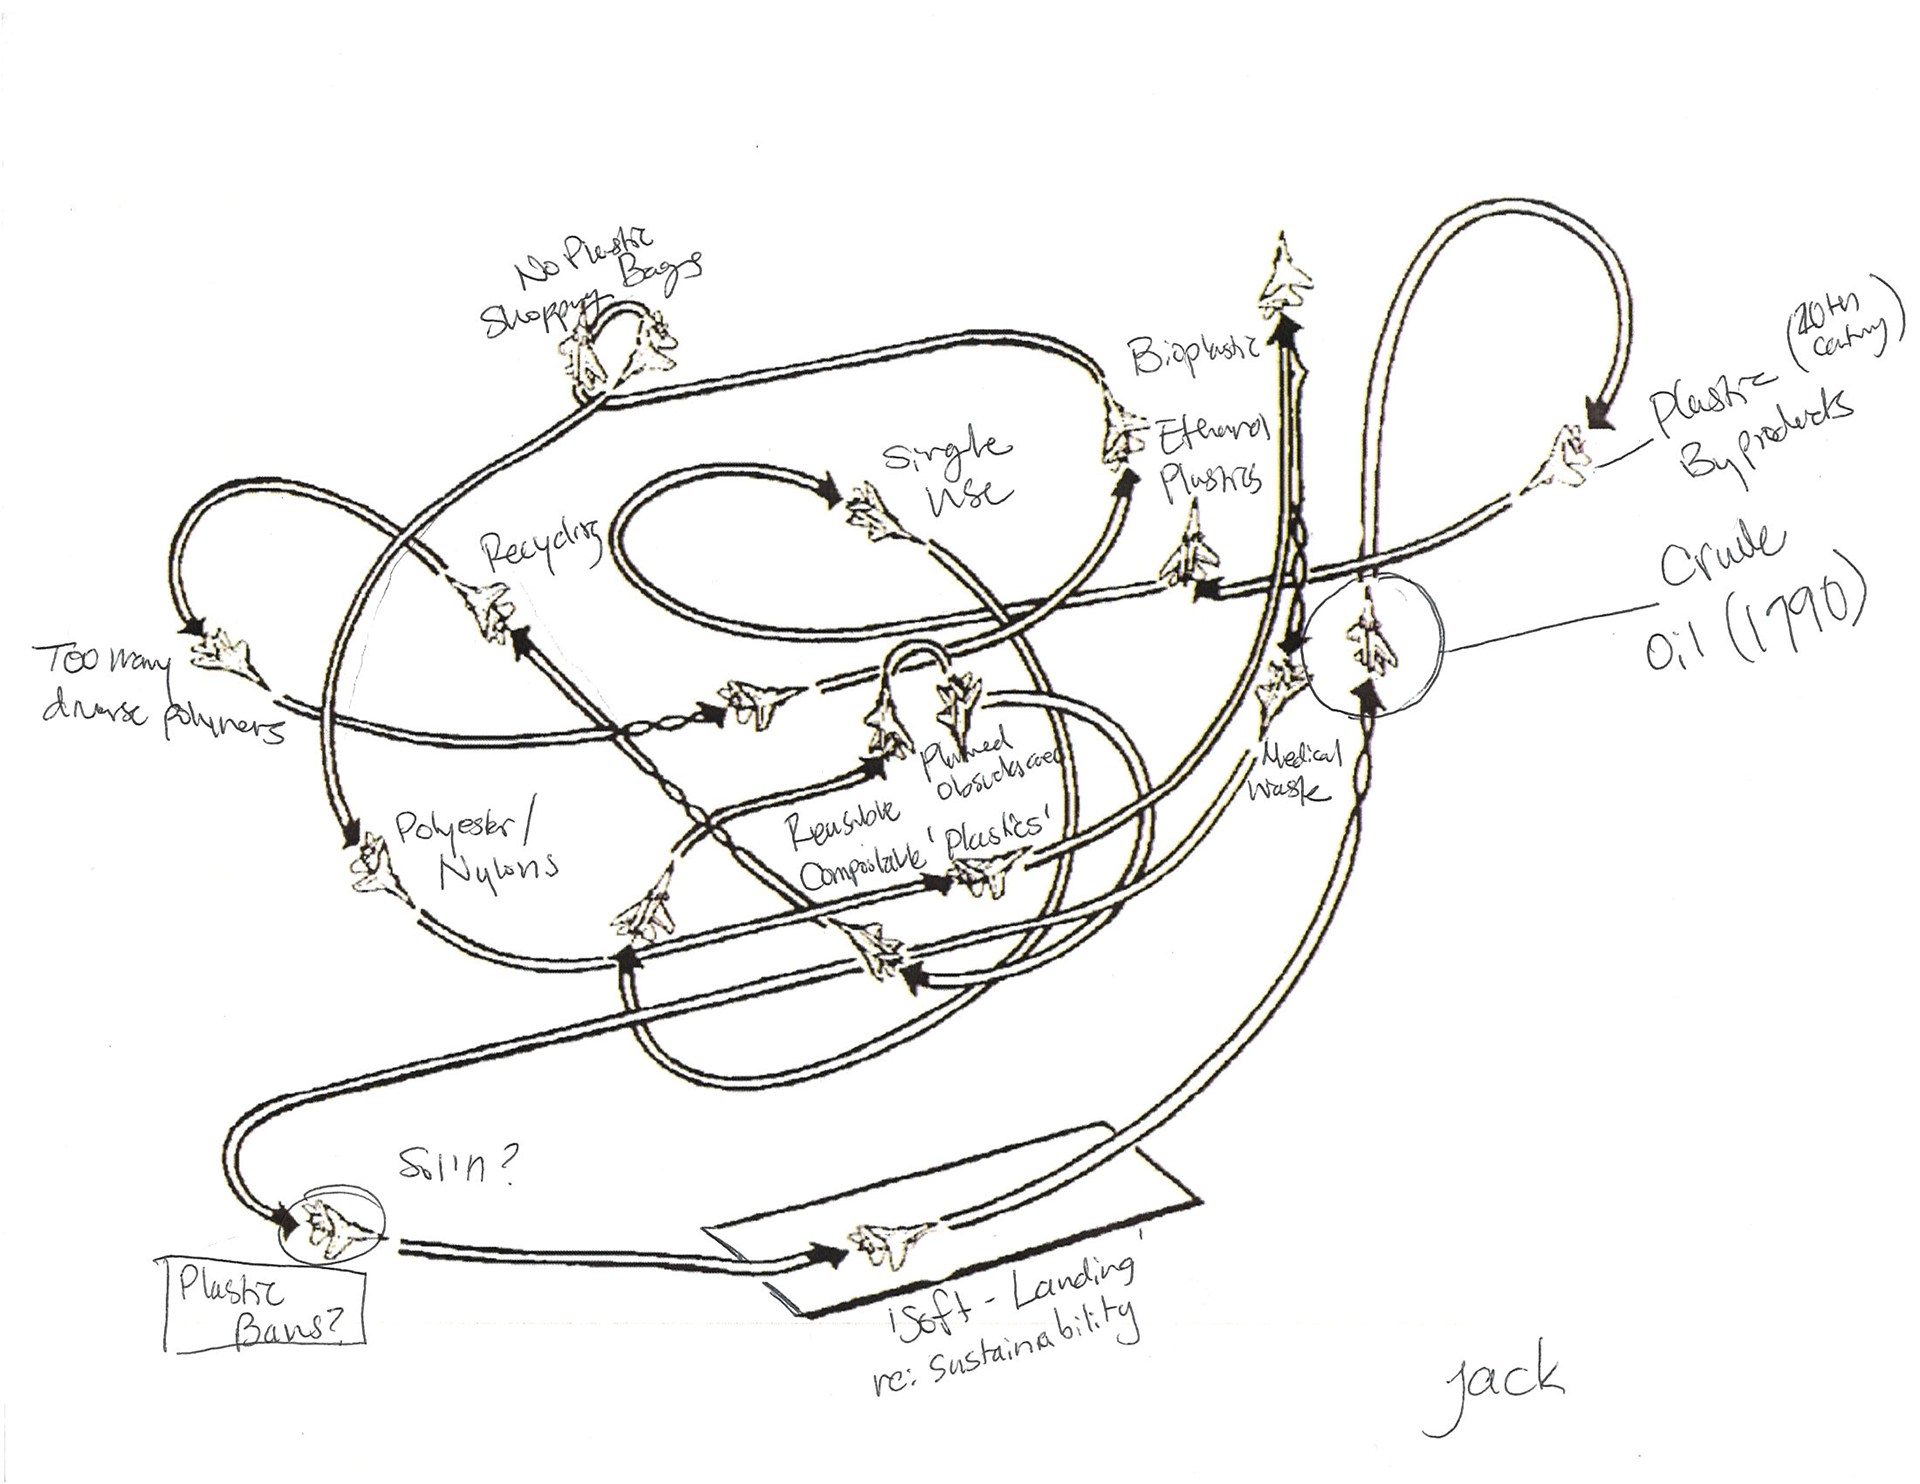
recycling systems mapped onto a diagram of jet plane maneuvers (by Jack)
What is Hack-a-Diagram?
Hack-a-Diagram is a public engagement tool created to help participants map complex systems and ideas quickly.
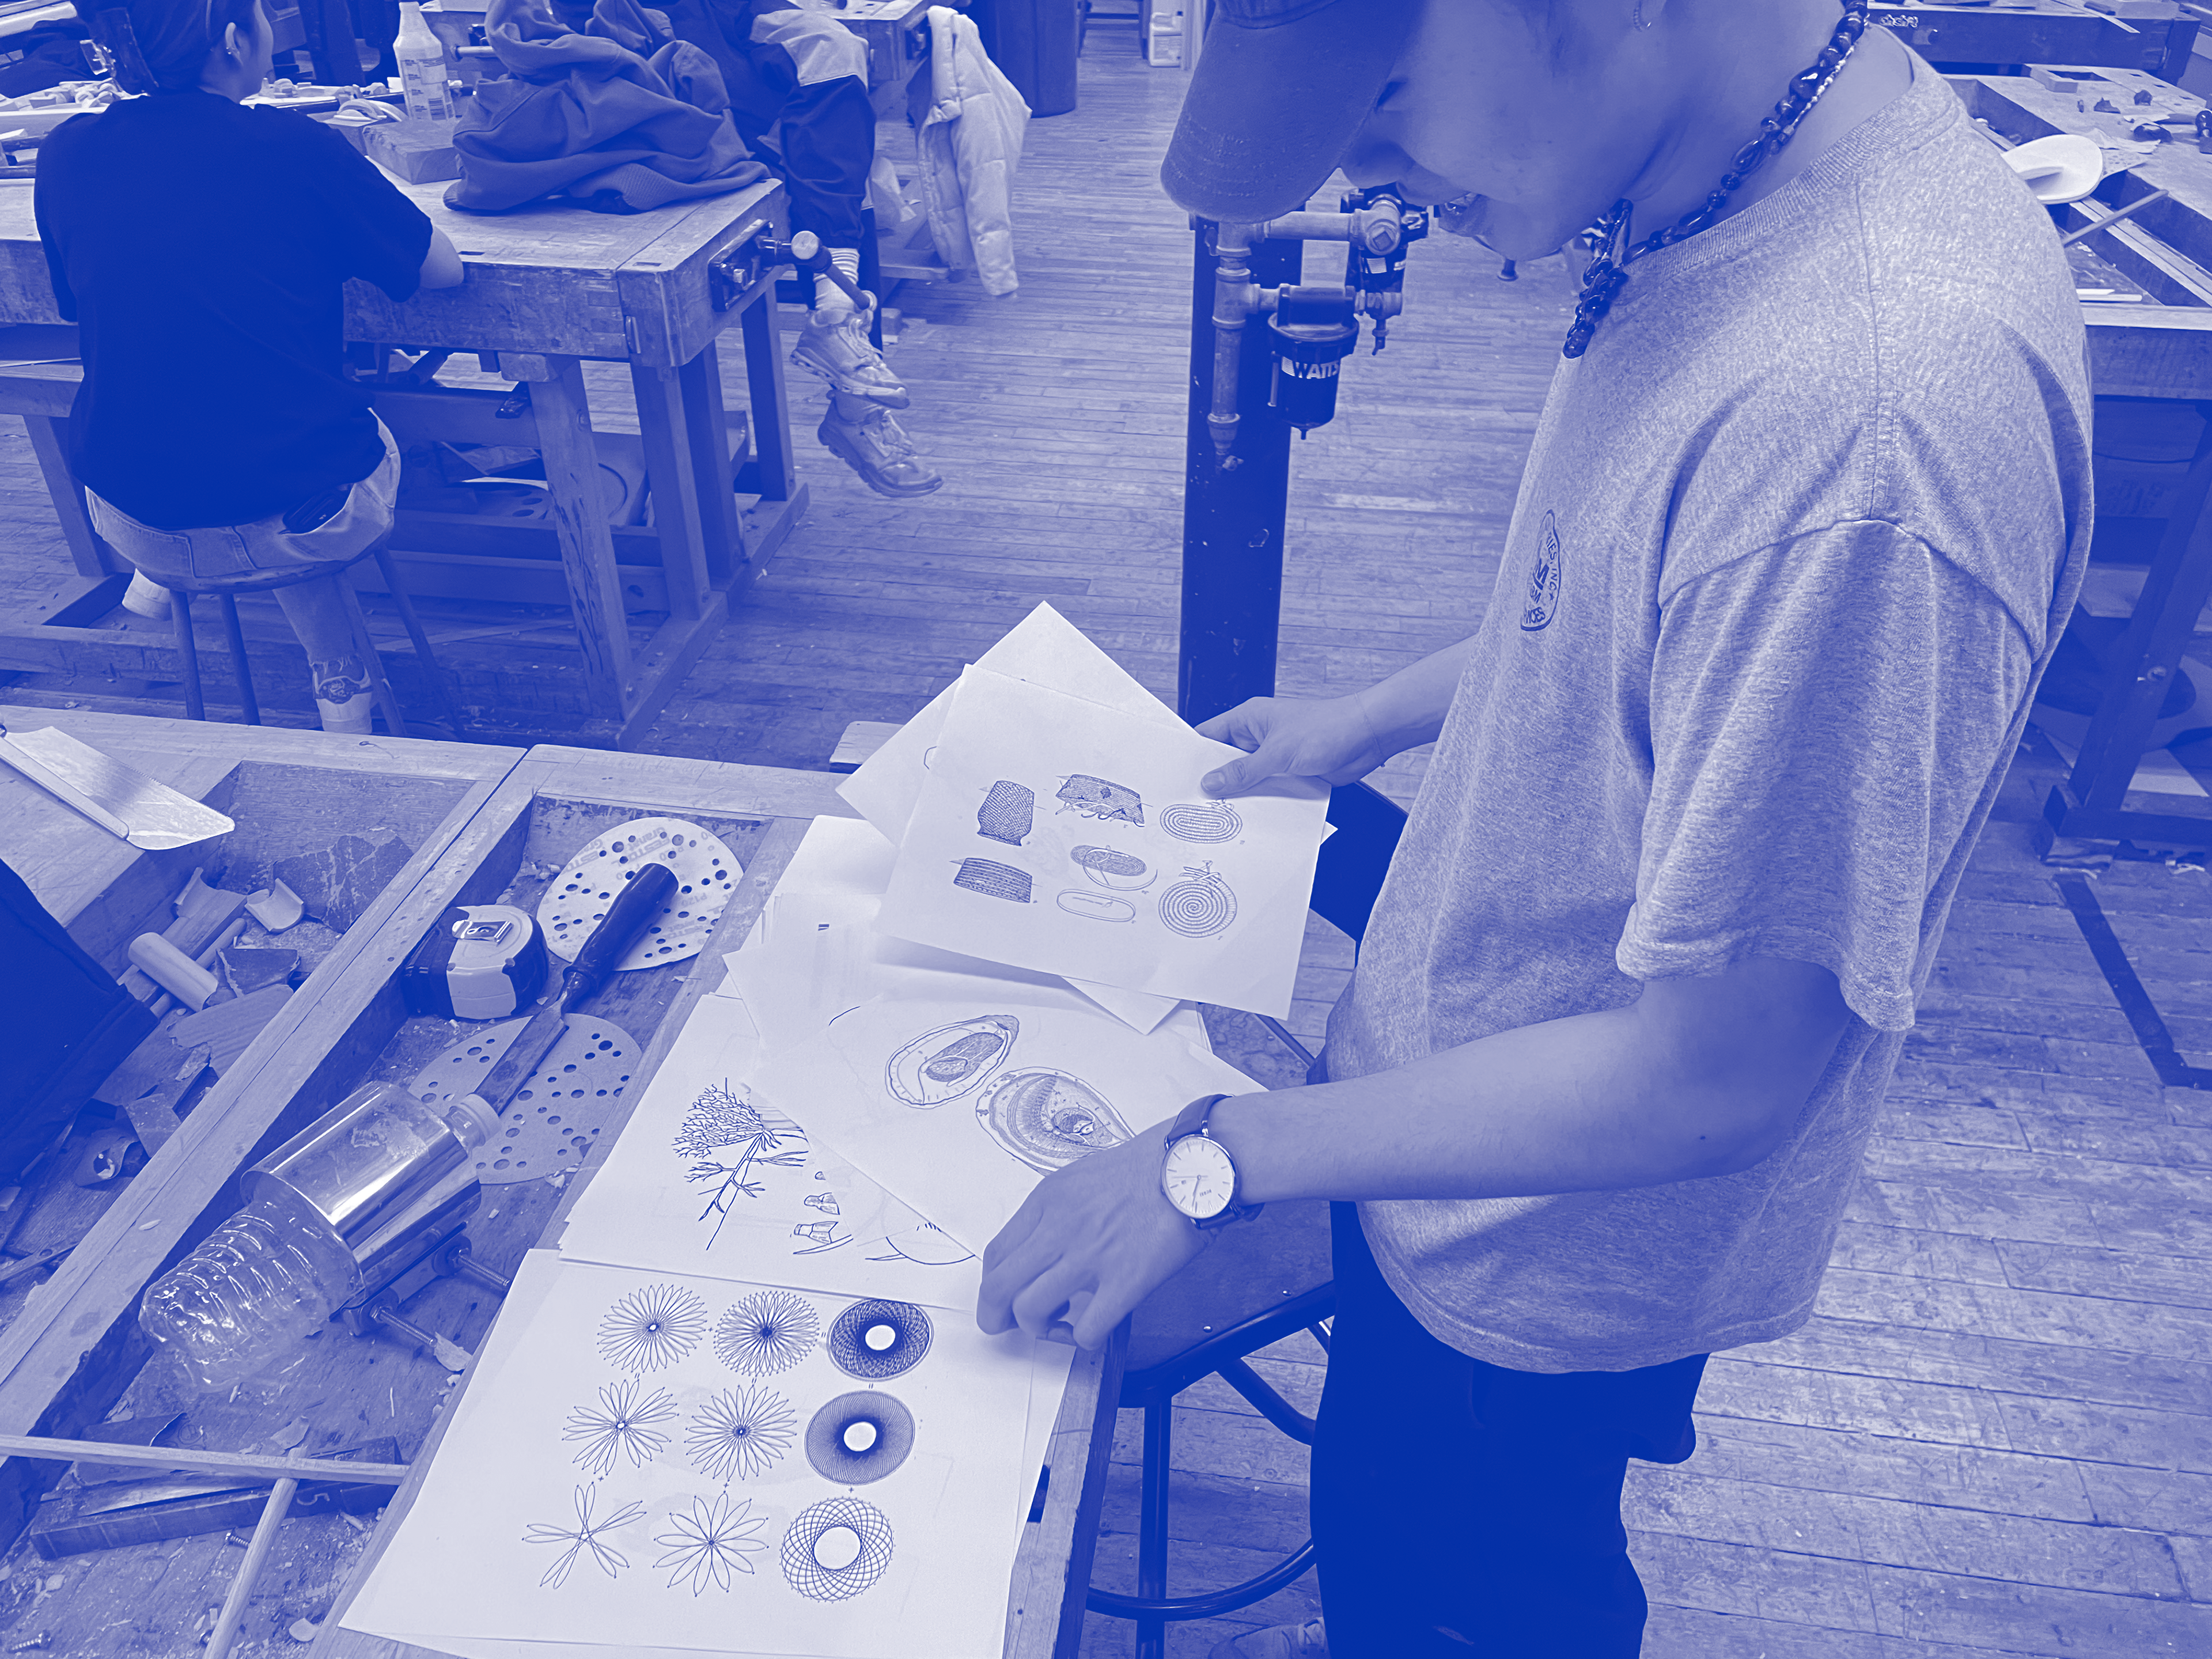
It's made up of a set of 100 unique diagrams, removed from their contexts and stripped of their labels. Participants in the activity are instructed to choose a diagram from a messy pile and "hack" it, mapping the topic at hand onto the various shapes, lines, and illustrations.
It relies on the facilitation of mis-matching, forcing users into a kind of friction, one that requires them to think creatively and metaphorically in order to accomplish a goal.
The image above is an example of what an outcome of that process might look like.

In this activity, the diagrams become places of transformation: how do their contents and forms influence the way we think about problems? or how we begin to solve them?
Opportunity:
If the diagrams themselves influence the ways we map onto them, could the selection of a diagram become a tool for us to facilitate the activity better? to guide users towards a more specific outcome?
Approach:
Execute a series of tests and interviews to better understand how people interact with and interpret the diagrams.
Use these learnings to organize the Diagrams into separate sets that serve different goals
Research Round 1
gaining a baseline understanding of people's relationship to Hack-a-diagram and it's contents

Kisaki selects a diagram during one of the small group tests
Process:
Facilitated the hack-a-diagram activity 18 times (both one on one and in small groups) as instructed in the original documentation.
Performed in-depth interviews with the participants immediately afterwards.
Findings:
Many of the abstract diagrams were unrecognizable to users, but were also attractive because of their obscurity.
Individuals selected diagrams primarily based on personal affinity, humor, or by matching the complexity to the problem.


click to view some of the hacked diagrams up close :)
Research Round 2
Learn about people's understandings of the diagrams themselves. Which ones do they recognize? Which ones don't they?

Process:
Facilitated a card sorting activity in which participants were asked to sort the diagrams into separate categories: the ones they recognized, the ones they were unsure about, and the ones they had no clue about.
They were asked to label the diagrams with their understandings of what was pictured.
Findings:
Many of the more technical diagrams, of circuits, networks, etc, were not understood, while diagrams with more pictographic qualities were widely understood.
Abstract diagrams were often placed in the maybe category, and accompanied by interpretations or guesses as to what their contents were.
Research Rounds 3-5
Testing the ability of diagrams to guide user's experience in a particular direction.
Process:
In rounds 3-5, I ran the hack-A-diagram activity again, using the newly categorized sets of diagrams, and interviewed them afterwards on their experience of the diagram.
Findings:
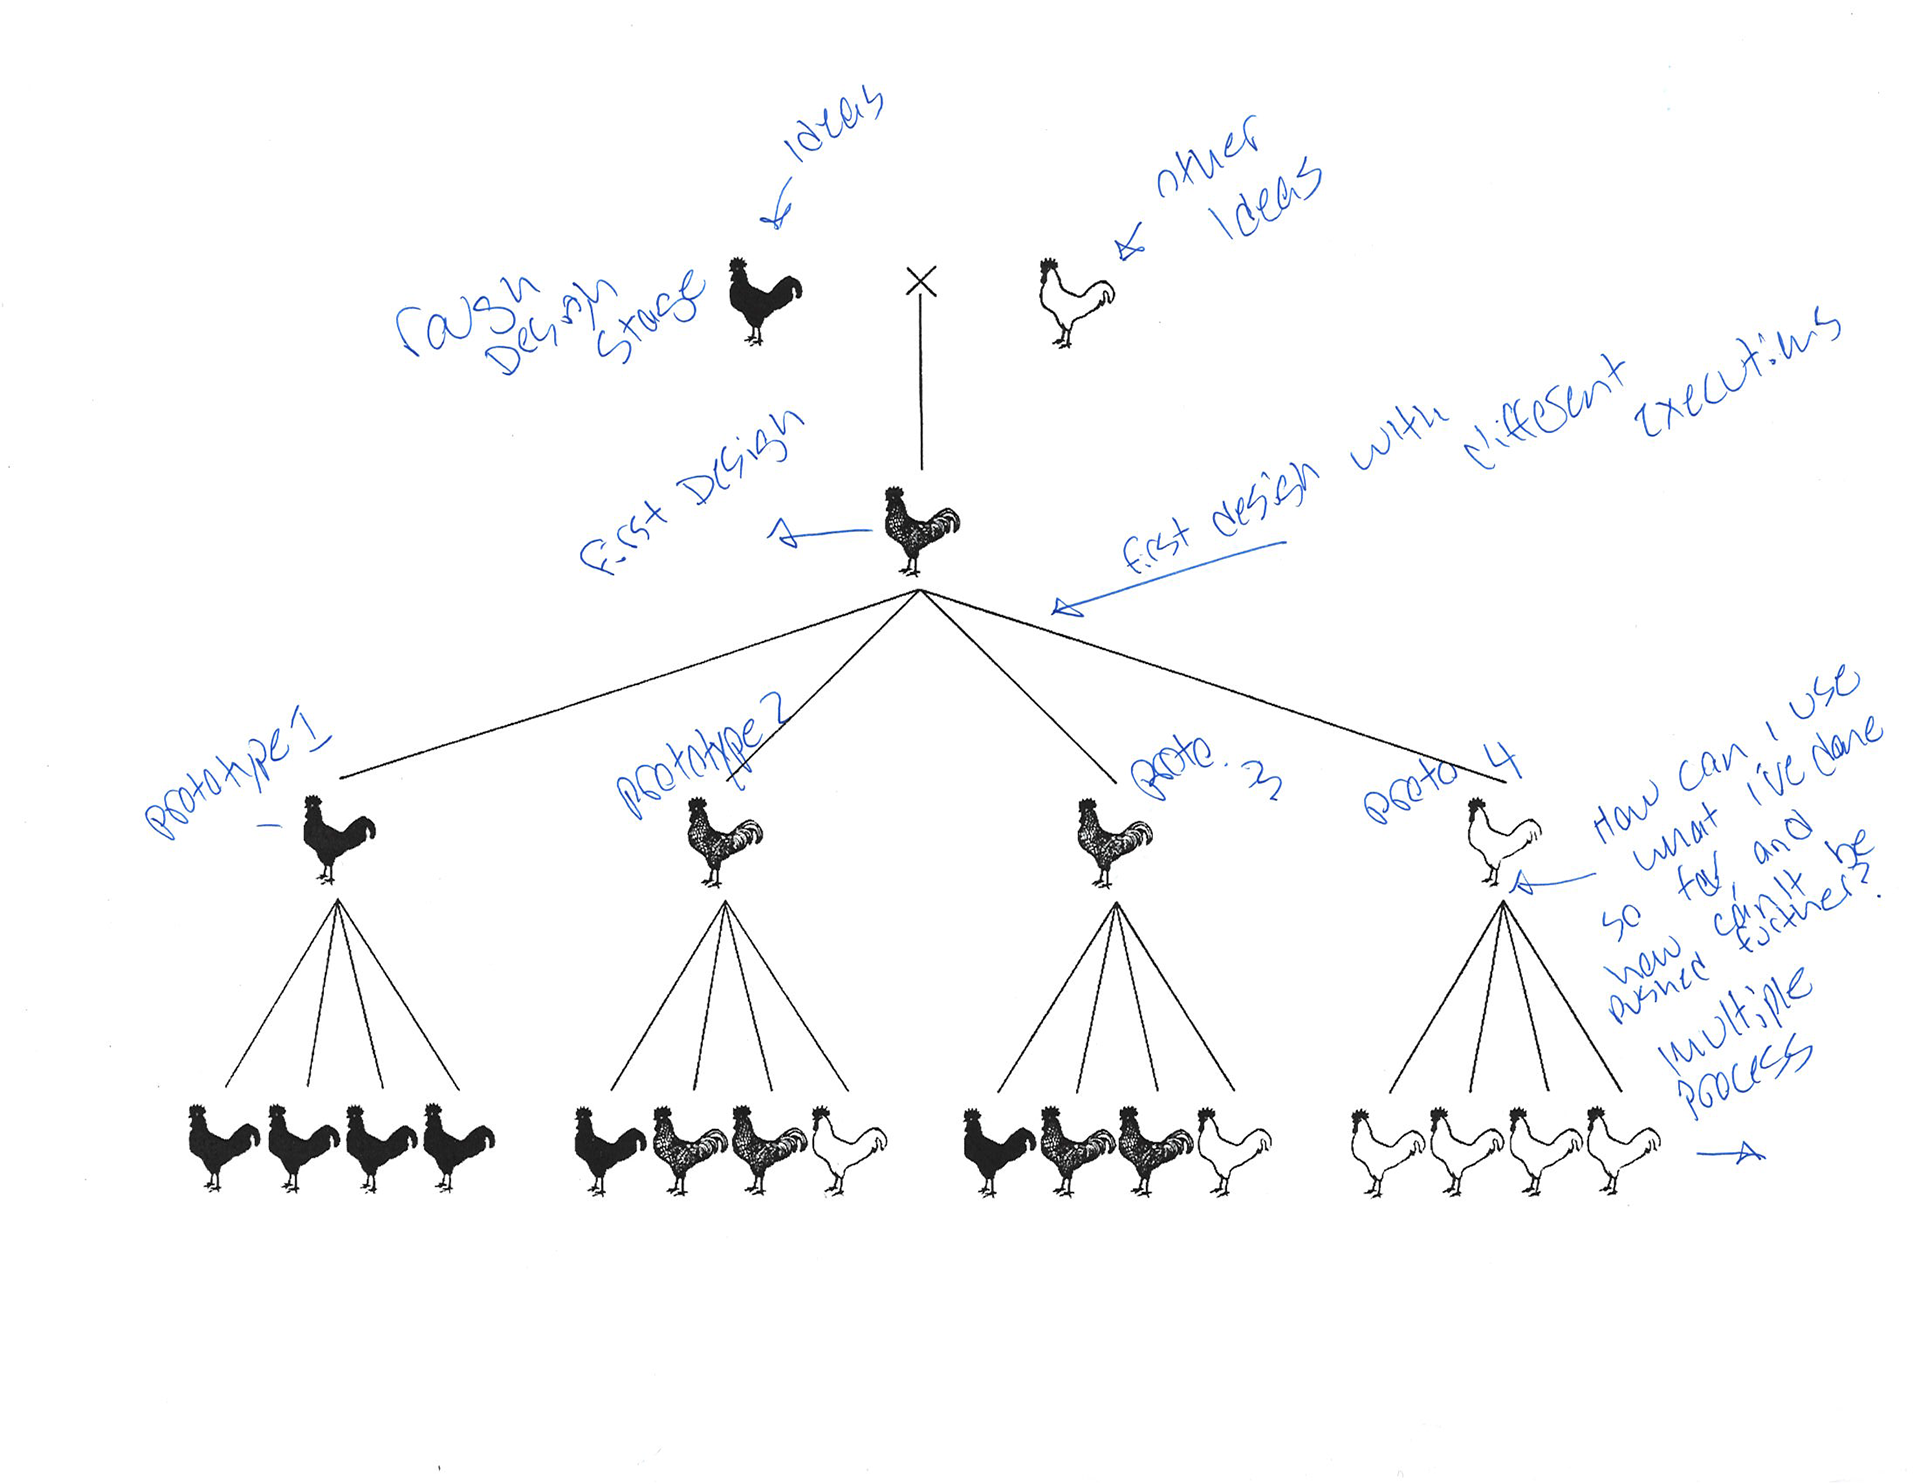
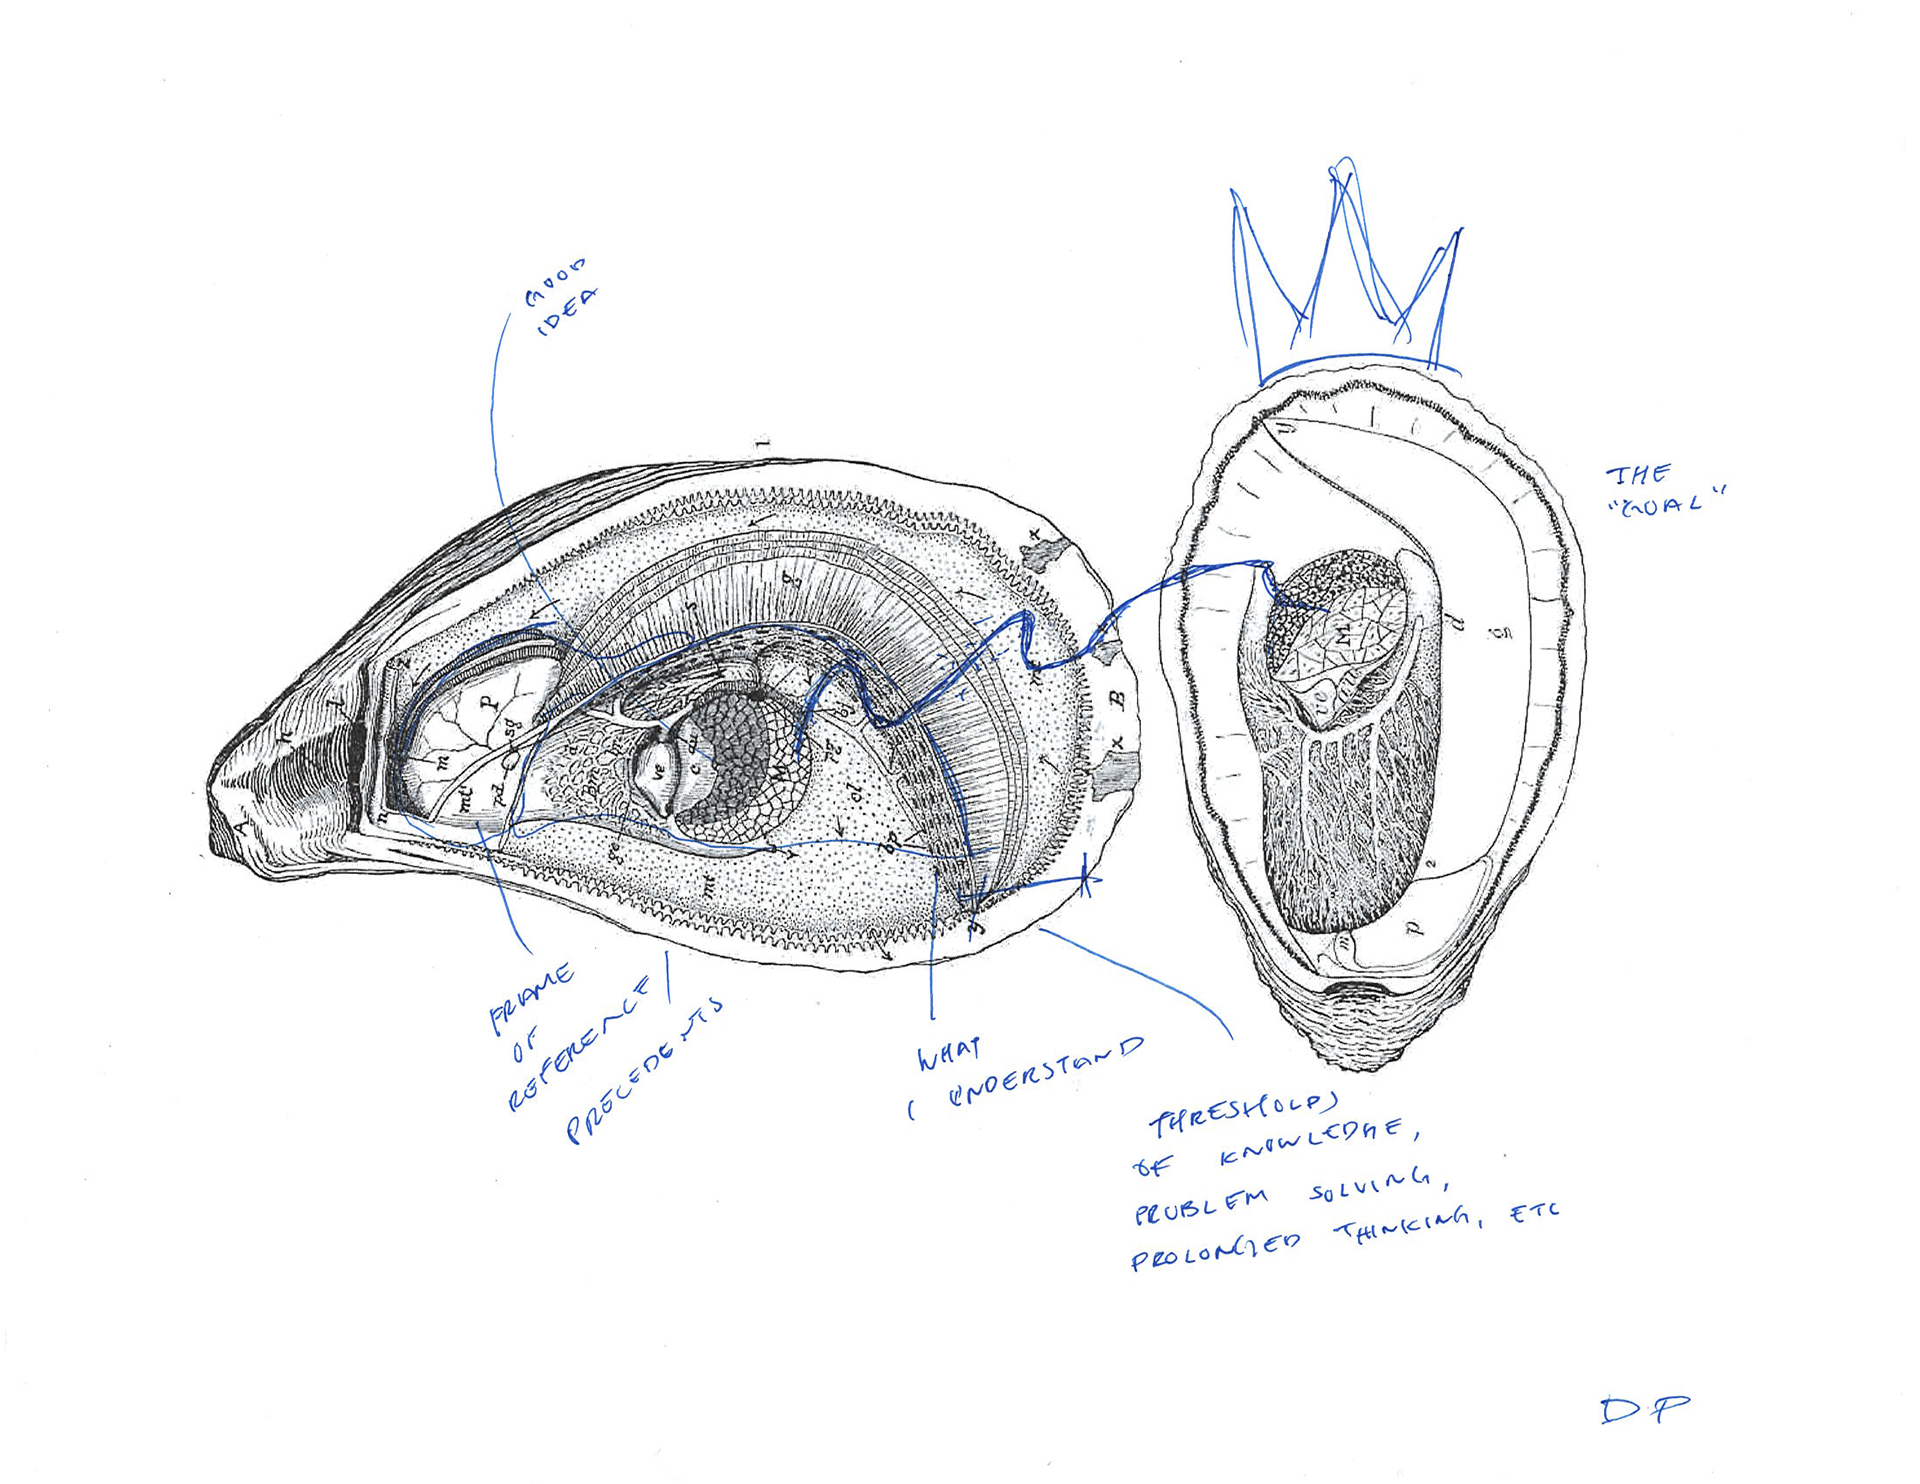
The participants with recognizable diagrams relied on the literal meaning of their diagram to create metaphors for describing the idea or problem.
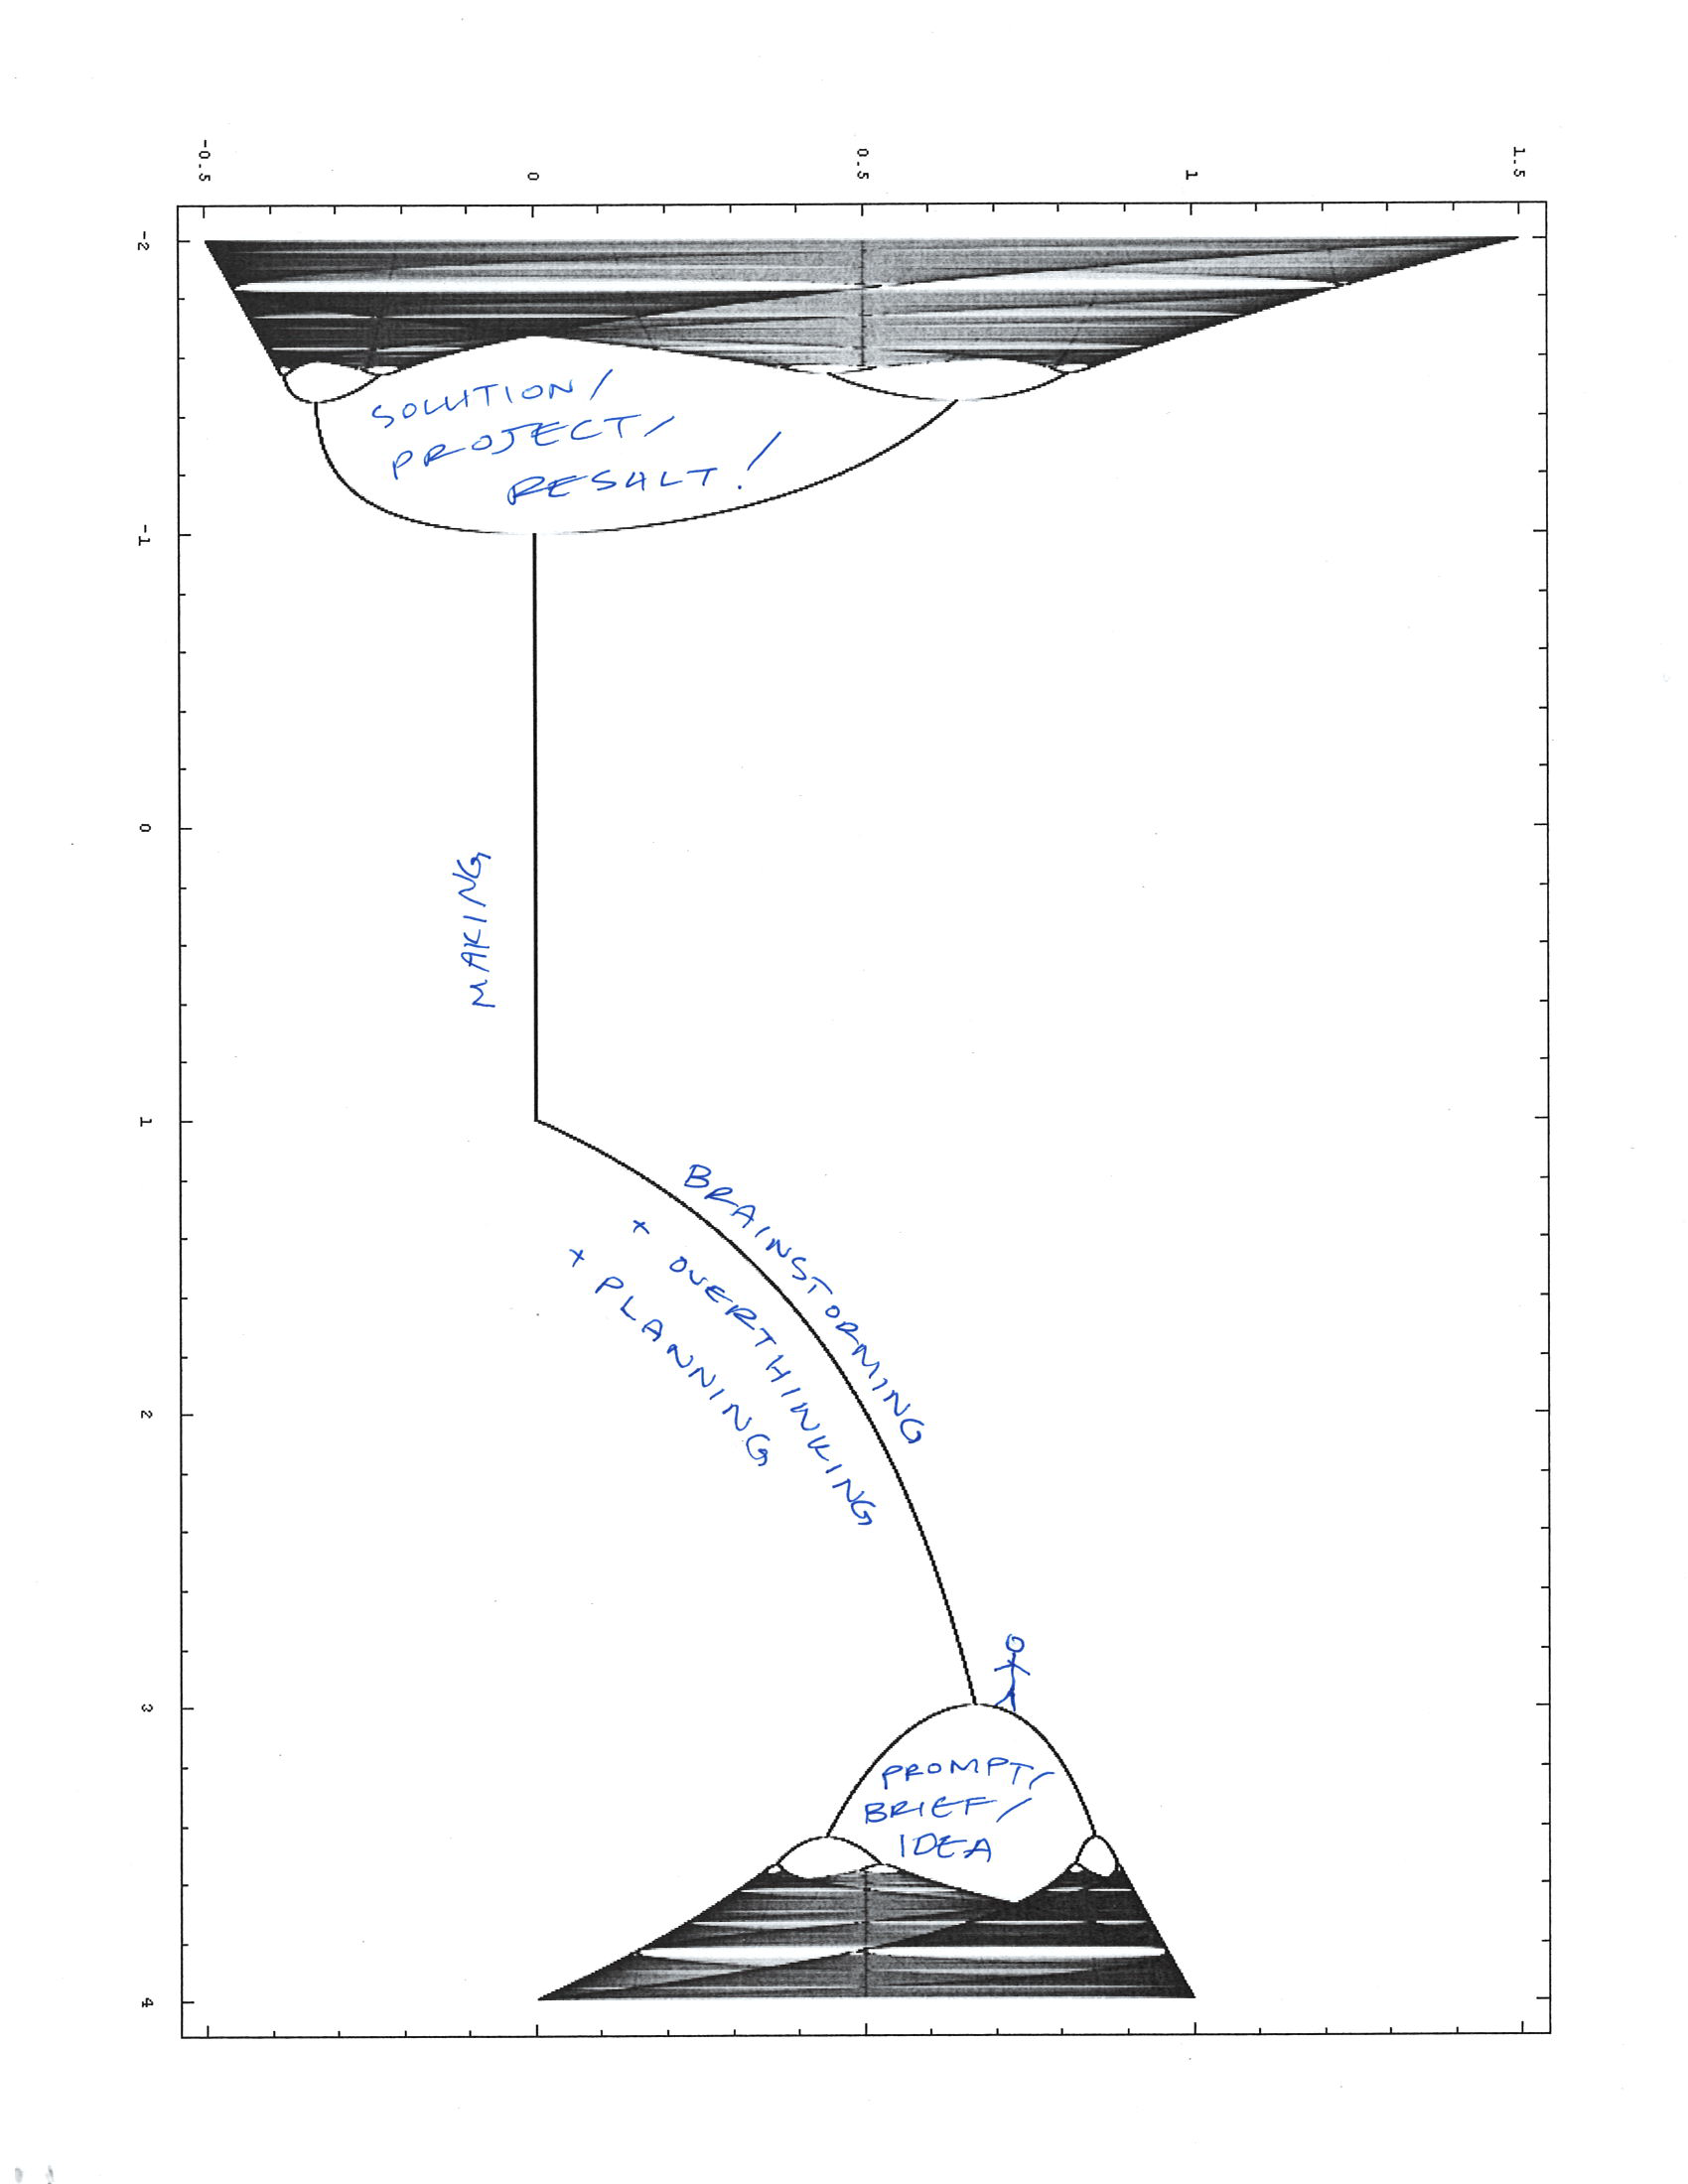
Users with abstract and non-recognizable diagrams used formal elements of the diagram to create spatial relationships between parts of ideas, coming together into larger maps.
Individuals using complex diagrams said that it forced them to expand on and direct ideas more than they had before.
and...
Participants with simple or minimal diagrams felt they had to synthesize their thoughts in order to fit them into the diagram.
Conclusion :
Based on these learnings, I packaged the tool (originally a loose stack of printed diagrams) into two spiral bound volumes of curated diagrams. One volume for synthesizing complicated topics, and the other one for expanding topics into their smallest parts. Each volume contains two sections, one for mapping, and one for describing.
Within the use-case of ds4si's Design Gym, these volumes will allow facilitators to help constituents to address the problems they're interested in designing for in a more tailored way, ensuring that the diagram being used is the right tool for the job.
[[[ digital copies of these volumes coming soon! ]]]